Plot q-curve profile for a single gene comparing groups
Source:R/generate_plots.R
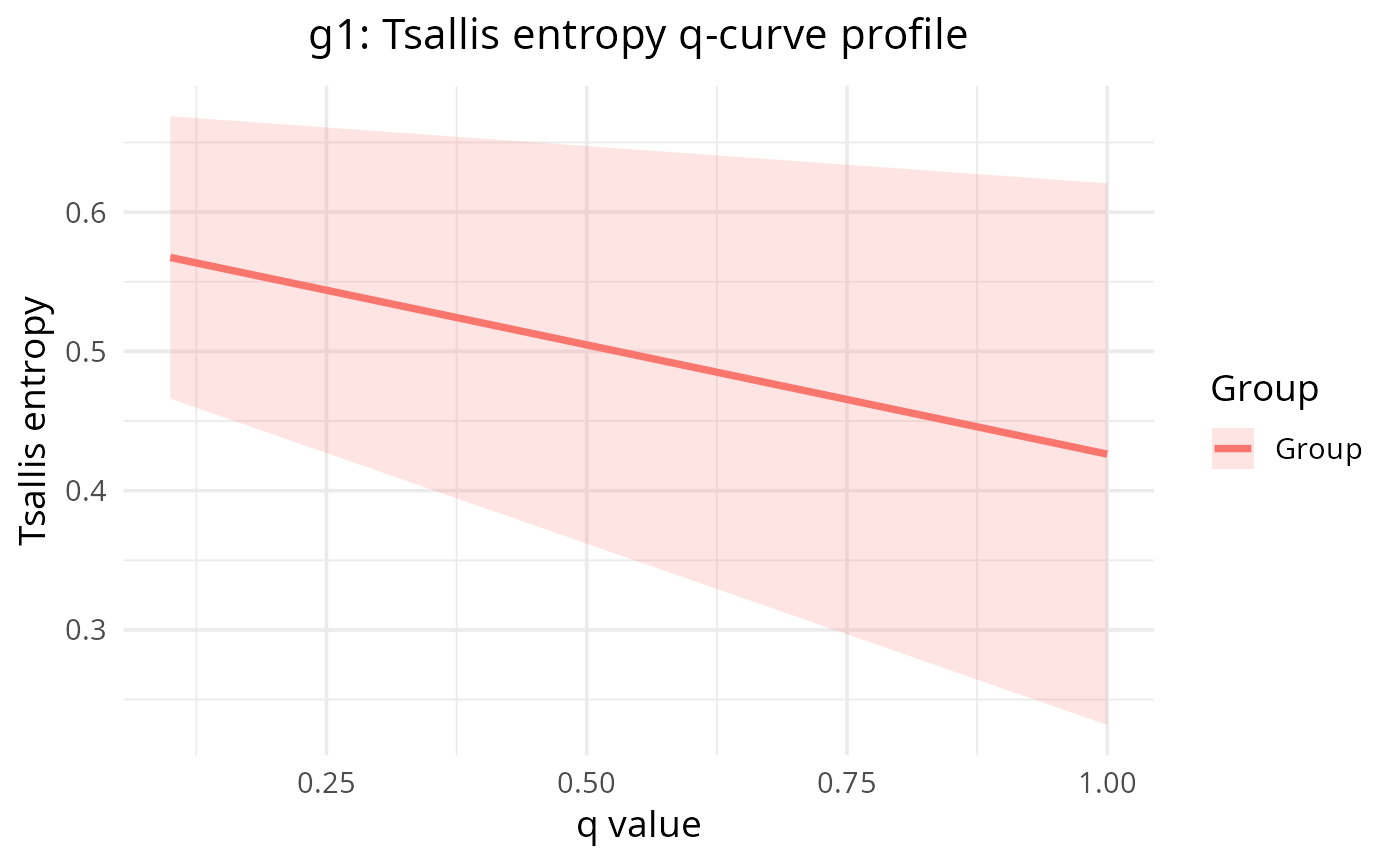
plot_tsallis_gene_profile.RdFor a selected gene, plot per-sample Tsallis entropy across q values and overlay per-group median +/- IQR ribbons so group-level differences are easy to compare. Expects a `SummarizedExperiment` produced by `calculate_diversity()` with `_q=` suffixes in column names.
Usage
plot_tsallis_gene_profile(
  se,
  gene = NULL,
  lm_res = NULL,
  n_top = 10,
  assay_name = "diversity",
  sample_type_col = "sample_type",
  show_samples = FALSE
)
Arguments
- se
A `SummarizedExperiment` from `calculate_diversity()`.
- gene
Character scalar or vector; gene symbol(s) to plot. If NULL and `lm_res` is supplied, the top `n_top` genes from `lm_res` (by `adj_p_interaction` or `p_interaction`) are used.
- lm_res
Optional data.frame result from `calculate_lm_interaction()`. When supplied and `gene` is NULL, the top `n_top` significant genes will be plotted.
- n_top
Number of top genes to plot when `lm_res` is provided (default: 10).
- assay_name
Name of the assay to use (default: "diversity").
- sample_type_col
Column name in `colData(se)` with sample type labels (default: "sample_type"). If missing, a single-group fallback is used.
- show_samples
Logical; if TRUE, draw per-sample lines in the background (default: FALSE).