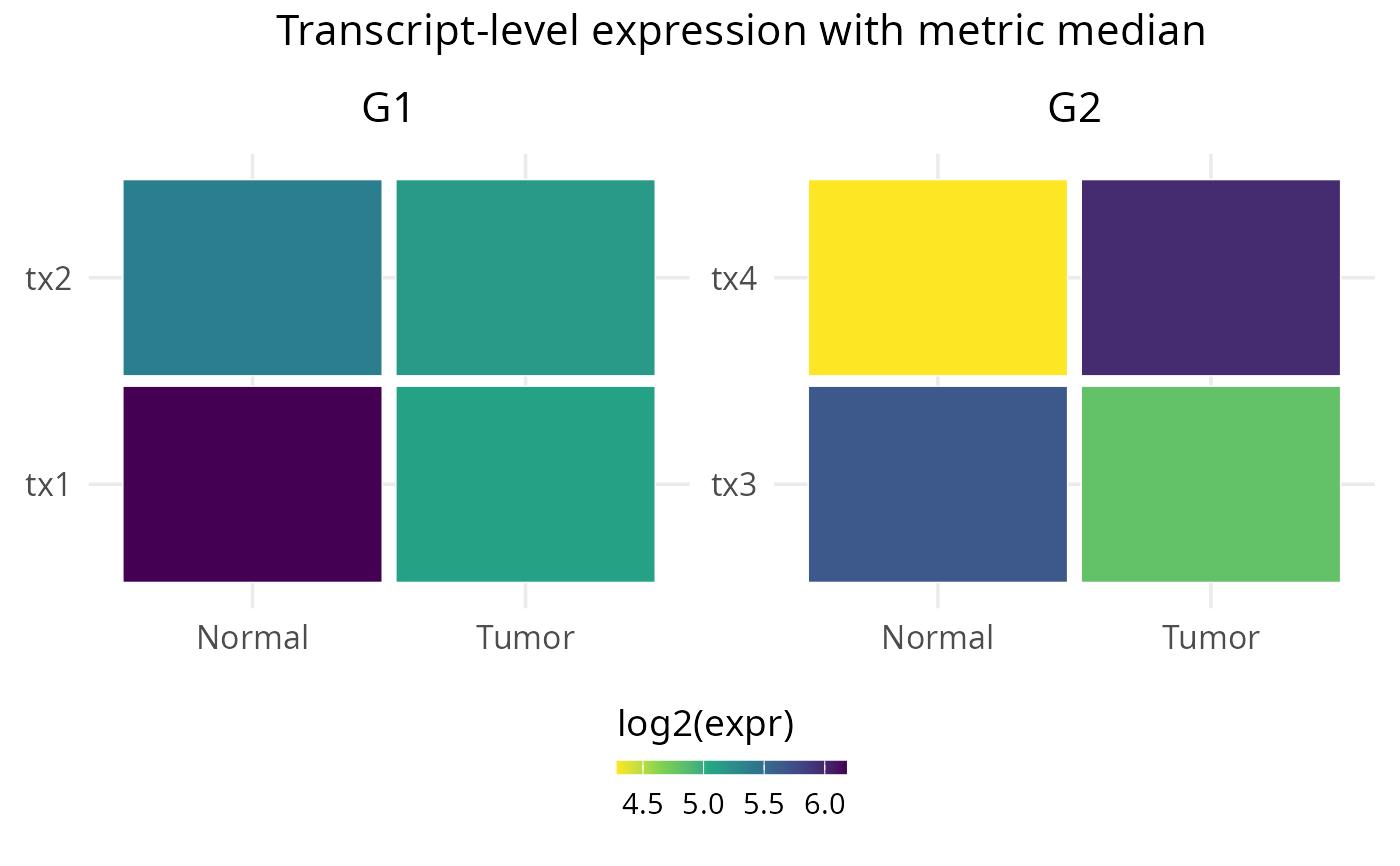
Plot top transcripts for a gene
Usage
plot_top_transcripts(
  counts,
  readcounts = NULL,
  gene = NULL,
  samples = NULL,
  coldata = NULL,
  sample_type_col = "sample_type",
  tx2gene = NULL,
  res = NULL,
  top_n = 3,
  pseudocount = 1e-06,
  output_file = NULL,
  metric = c("median", "mean", "variance", "iqr")
)
Arguments
- counts
Matrix or data.frame of transcript counts. Rows are transcripts and columns are samples.
- readcounts
Optional matrix or data.frame of raw read counts. Used for transcript-level quantification if provided.
- gene
Character; gene symbol to inspect.
- samples
Character vector of sample group labels (length = ncol(counts)).
- coldata
Optional data.frame or file path containing sample metadata. Used to infer sample groups if `samples` is not provided.
- sample_type_col
Character; column name in `coldata` or `SummarizedExperiment` colData to use for sample grouping. Default is "sample_type".
- tx2gene
Path or data.frame mapping transcripts to genes. Must contain columns `Transcript` and `Gen`.
- res
Optional result data.frame from a differential analysis. If provided and `gene` is NULL, top genes are selected by adjusted p-value.
- top_n
Integer number of transcripts to show (default = 3). Use NULL to plot all transcripts for the gene.
- pseudocount
Numeric pseudocount added before log2 (default = 1e-6) to avoid division by zero.
- output_file
Optional file path to save the plot. If `NULL`, the `ggplot` object is returned.
- metric
Aggregation metric used to summarize transcript expression per group when plotting. One of c("median", "mean", "variance", "iqr"). Use "iqr" to compute the interquartile range. Defaults to "median".
Value
If output_file is NULL, returns a ggplot object. Otherwise, the plot is saved to the specified file and the function returns NULL invisibly.
Examples
tx_counts <- matrix(sample(1:100, 24, replace = TRUE), nrow = 6)
rownames(tx_counts) <- paste0("tx", seq_len(nrow(tx_counts)))
colnames(tx_counts) <- paste0("S", seq_len(ncol(tx_counts)))
tx2gene <- data.frame(Transcript = rownames(tx_counts), Gen = rep(paste0("G", seq_len(3)), each = 2), stringsAsFactors = FALSE)
samples <- rep(c("Normal", "Tumor"), length.out = ncol(tx_counts))
plot_top_transcripts(tx_counts, gene = c("G1", "G2"), samples = samples, tx2gene = tx2gene, top_n = 2)