Plot MA using expression/readcount-based fold changes
Source:R/generate_plots.R
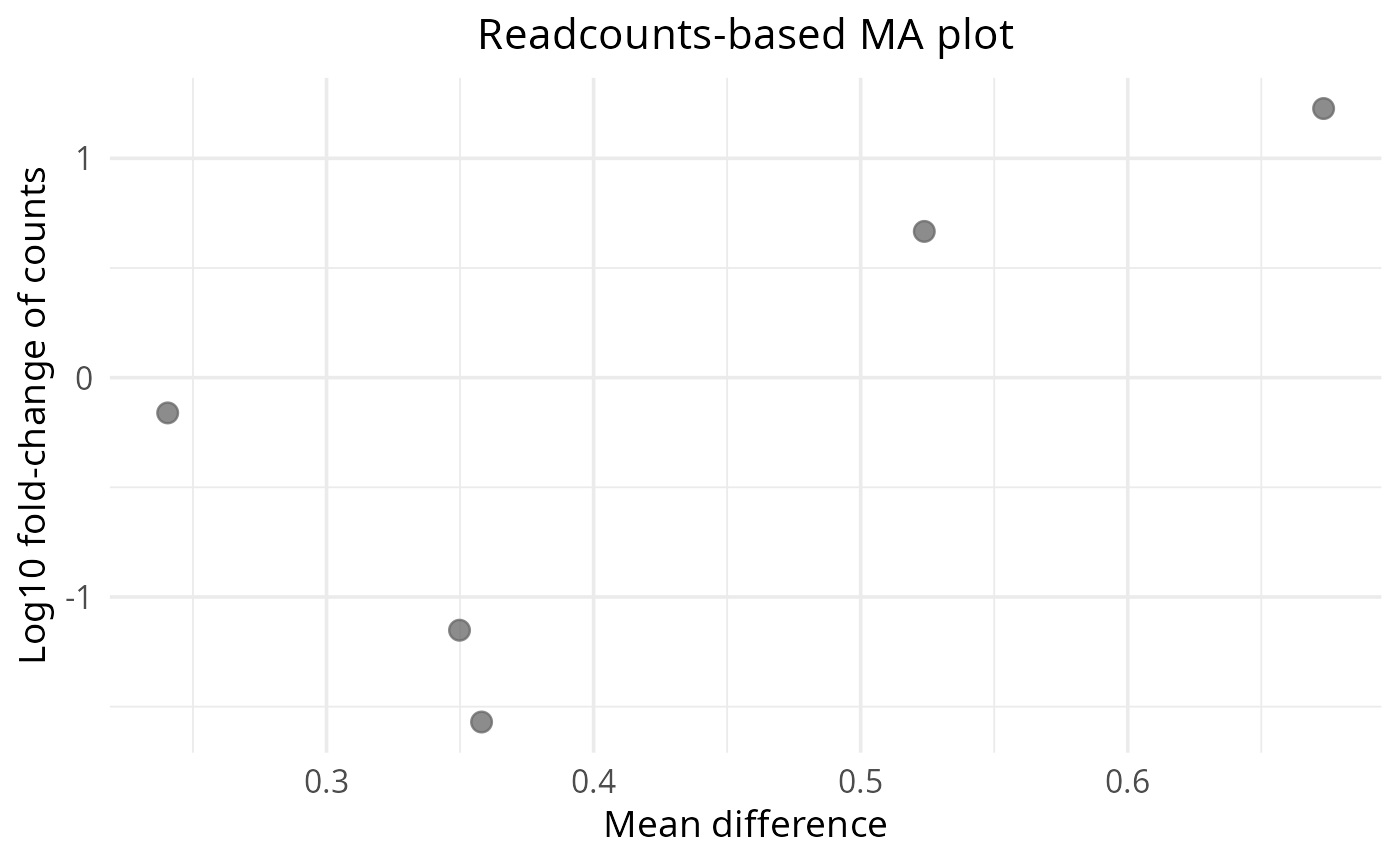
plot_ma_expression.RdWrapper around `plot_ma(..., type = "expression")` that accepts a `SummarizedExperiment` or precomputed fold-change `data.frame`.
Usage
plot_ma_expression(
  x,
  se,
  samples = NULL,
  control = NULL,
  fc_method = "median",
  pseudocount = 0,
  sig_alpha = 0.05,
  x_label = NULL,
  y_label = NULL,
  title = NULL,
  ...
)
Arguments
- x
Data.frame from `calculate_difference()`.
- se
A `SummarizedExperiment` or data.frame supplying readcounts or precomputed fold changes.
- samples
Optional sample grouping vector (passed to `plot_ma`).
- control
Control level name (passed to `plot_ma`).
- fc_method
Aggregation method for fold-change calculation (passed to `plot_ma`).
- pseudocount
Pseudocount added when computing log ratios (passed to `plot_ma`).
- sig_alpha
Numeric significance threshold for adjusted p-values (default: 0.05).
- x_label
Optional x-axis label passed to `plot_ma`.
- y_label
Optional y-axis label passed to `plot_ma`.
- title
Optional plot title passed to `plot_ma`.
- ...
Additional arguments passed to `plot_ma()`.
Examples
x <- data.frame(genes = paste0("g", seq_len(5)), mean = runif(5))
fc <- data.frame(genes = paste0("g", seq_len(5)), log2_fold_change = rnorm(5))
plot_ma_expression(x, se = fc)