The Problem
RNA-seq analysis typically addresses one of three complementary biological questions: (1) which genes change in total abundance?, (2) which individual transcripts shift their abundance?, (3) which transcripts shift their proportions within genes, independent of total abundance?
However, a fourth question remains largely invisible: how does isoform-usage complexity change?
The Solution
TSENAT captures isoform-usage complexity throught Tsallis entropy, whose entropic index parameter (q) enables to evaluate different data dimensions:
Low q (e.g., 0.5): Focuses on rare isoforms - detects if diversity is maintained or collapsed
Mid q (e.g., 1.0): Balanced view (Shannon entropy) - overall isoform complexity
High q (e.g., 2.0): Focuses on dominant isoforms - detects dominance shifts
By examining diversity across multiple entropic indices (q-values), TSENAT allows to identify scale-dependent diversity changes - the hallmark of coordinate isoform switching.
The Mathematics Behind Tsallis Entropy
Tsallis entropy is a parametric family of diversity measures that generalizes Shannon entropy and enables tuning sensitivity to different scales of isoform organization.
Mathematical Definition: For a discrete probability vector representing isoform proportions within a gene, Tsallis entropy is:
This elegant formula unifies diverse diversity concepts at specific entropic indices (q-values):
- q = 0: Support richness — the number of isoforms with positive support. Every positive-support isoform contributes equally; it does not weight rare abundance values. q = 0 is evaluated on the RAW (pre-pseudocount) support, so pseudocount regularization does not change it.
- q = 1: Shannon entropy — Standard information-theoretic measure; balanced weighting across scales.
- q = 2: Gini-Simpson entropy — emphasizes dominant isoforms and relatively downweights rare isoforms.
More generally, for sensitivity to low-abundance isoforms increases as q decreases, while for emphasis on common/dominant isoforms increases with q.
Divergence Analysis: Measuring Information-Theoretic Distance Between Conditions
While Tsallis entropy quantifies diversity within a single distribution, Tsallis divergence measures the information-theoretic separation between two distributions. It is directional: TSENAT reports the divergence from the control composition to the treatment composition , and in general — it is not a symmetric distance. The argument order is therefore part of the result.
Mathematical Definition (Furuichi formula): For two probability distributions and representing isoform proportions in control and treatment conditions, Tsallis divergence is:
where and are the probability values at position for the two distributions and ( is the entropic parameter, not an index). The limit gives the Kullback–Leibler divergence.
Tsallis divergence enables the quantification of how fundamentally different the isoform complexity patterns are between experimental conditions.
Installation
Requirements: R >= 4.5.0
The easiest way to install TSENAT is through Bioconda:
To install the latest development version from GitHub:
remotes::install_github("gallardoalba/TSENAT")Quick Start
Load Example Data
Start by loading the built-in example dataset from TSENAT, which includes transcript-level read counts, TPM values, and effective lengths from Salmon quantification. Then load the sample metadata and annotation file that describe your experimental design.
suppressMessages({
  library(TSENAT)
  library(SummarizedExperiment)})

# Load example dataset (includes readcounts, tpm, and effective_length)
data(readcounts)
readcounts <- as.matrix(readcounts)

# Load sample metadata and annotation
metadata_df <- read.table(
  system.file("extdata", "metadata.tsv", package = "TSENAT"),
  header = TRUE,
  sep = "\t")

gff3_file <- system.file(
  "extdata", "annotation.gff3.gz", package = "TSENAT")
Create configuration and build analysis
Create a configuration object specifying your experimental design parameters (sample/condition columns from metadata) before building the analysis object. This fail-fast pattern ensures invalid parameters are caught immediately before processing begins.
## Create configuration file
config <- TSENAT_config(
  q = seq(0, 2, by = 0.05),
  sample_col = "sample",
  condition_col = "condition",
  paired = TRUE,
  subject_col = "paired_samples",
  control = "normal",
  nthreads = 2
)

## Build TSENATAnalysis object
analysis <- build_analysis(
  readcounts = readcounts,
  tx2gene = gff3_file,
  metadata = metadata_df,
  config = config,
  tpm = tpm,
  effective_length = effective_length)
Both tpm and effective_length are stored in the analysis object’s metadata, where they serve distinct roles: tpm is used by filter_analysis() for abundance-based quality control, while effective_length is used by calculate_diversity() for length-normalized entropy computed from raw counts.
Orchestration Function
The TSENAT() function provides a complete, automated analysis pipeline in a single call. It takes your configured TSENATAnalysis object and executes all downstream analysis steps: entropy computation, statistical testing for entropic index (q-value) by condition interactions, and rich visualization. This is the recommended entry point for most users—it orchestrates the full workflow while respecting your configuration parameters (entropic indices, design, bootstrap settings, etc.) and handles output management seamlessly.
# Returns: Fully configured TSENATAnalysis object
result <- TSENAT(analysis)
Accessing Results
After running the analysis, retrieve results using the unified results() interface:
# Unified interface: request results by type
diversity_results <- results(result, type = "diversity")
sait_results <- results(result, type = "sait")
jackknife_results <- results(result, type = "jackknife", q = 1)

# Filter and rank results flexibly
ranked_sait <- results(result, type = "sait", rankBy = "padj", n = 50)
filtered_diversity <- results(result, type = "diversity", q = 1.0)

# Retrieve plots
diversity_plot <- results(result, type = "diversity", plot=TRUE)
print(diversity_plot)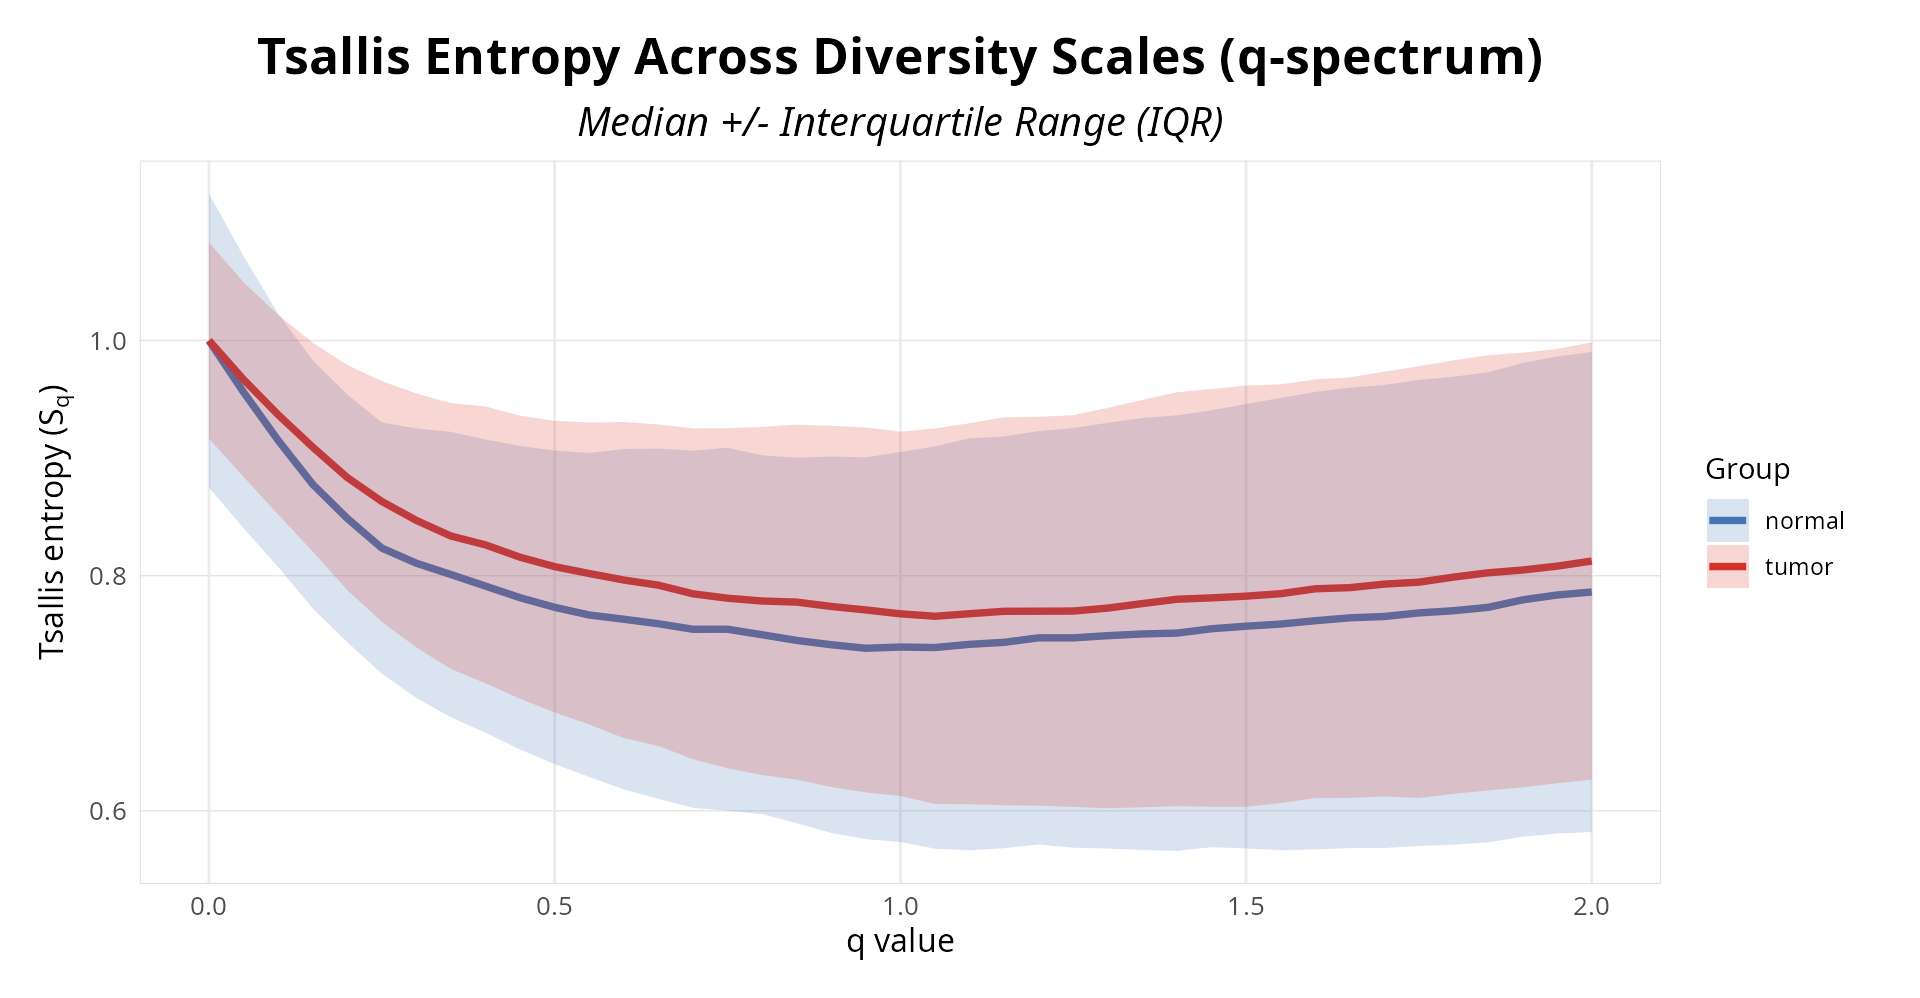
# Extract the scale-dependent genes plot
sait_plot <- results(result, type = "sait", plot = TRUE)
print(sait_plot)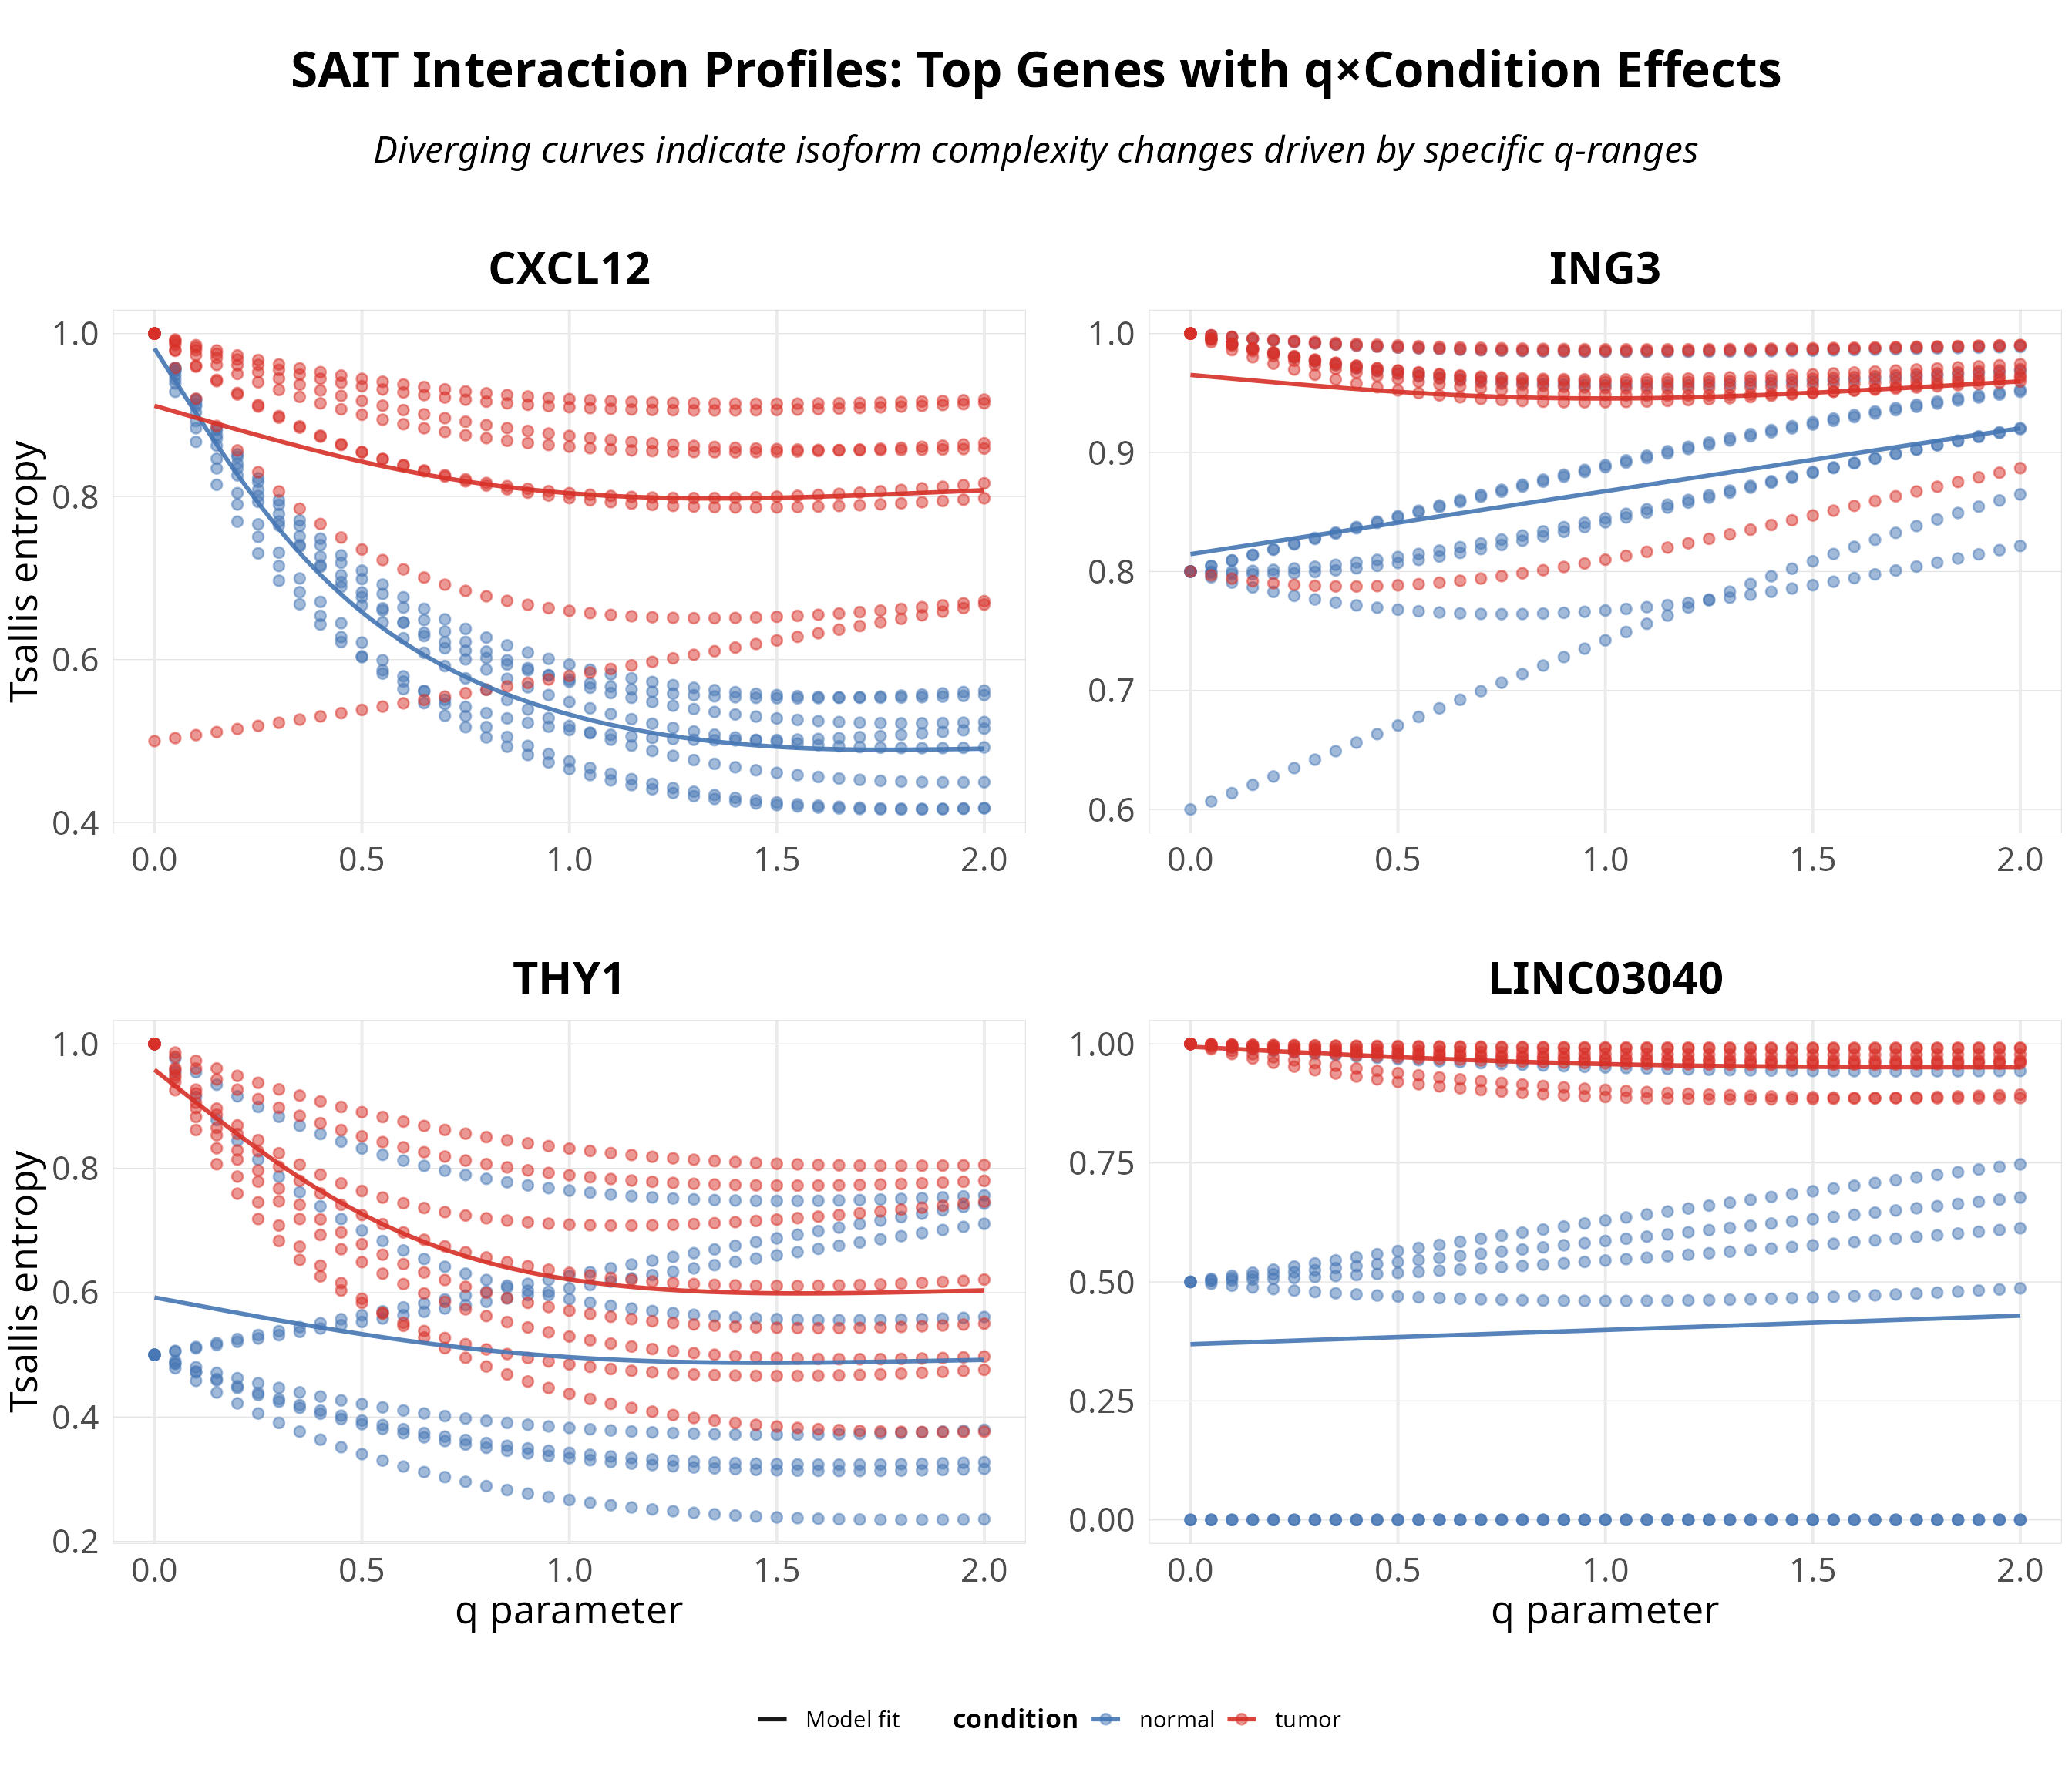
Documentation
For a complete walkthrough of the analysis pipeline with real biological examples, see the main package vignette. This includes theory background, step-by-step explanations of each analysis function, and interpretation guidance for understanding your results. It covers the entire workflow from loading Salmon-quantified data through entropy computation, statistical testing, and visualization.
Statistical Inference Methods
TSENAT provides a flexible statistical framework optimized for entropy-based diversity analysis. The recommended main workflow (paired design) uses a spline-based generalized additive mixed-model approach (GAMM-style), fitted with nlme::lme (natural regression splines, ns(q, df = 3) × condition), a subject random intercept, and an AR(1)-type working correlation within each subject × condition block, with the interaction tested via a marginal F-test. Note that this path does not use mgcv::gamm(), which is unstable for the paired configuration and is retained only as a fallback.
Continuous-q correlation. The primary paired correlation structure is a continuous-time AR(1) via nlme::corCAR1, so correlation decays with the actual distance between q-values, . This matters because q can be irregularly spaced: the grid-index form (legacy/fallback corAR1) is only valid for equally spaced q grids.
The statistical methods available in TSENAT include:
- Scale-adaptive interaction tests (SAIT): Multiple modeling approaches for repeated q-ordered measurements. GAM/GAMM, LMM, GEE and FPCA model within-subject correlation with a working AR(1) structure within each subject × condition block. Different paths carry different robustness assumptions: the primary paired regression-spline model assumes Gaussian residuals and uses the correlation structure for within-subject q dependence; heteroscedasticity is diagnosed but is not automatically incorporated through variance weights in this path.
- Aligned Rank Transform (ART): Rank-based non-parametric interaction testing via the ARTool package (Kay et al. 2021).
- M-estimation: Robust location estimation for group comparison using iteratively re-weighted least squares, resistant to outliers.
- Jackknife isoform switching (JIS): Leave-one-out resampling to identify transcripts with condition-specific switching patterns and quantify their influence on entropy differences.
Related Packages
Below is how TSENAT complements other Bioconductor tools:
| Tool | Answers | TSENAT Difference |
|---|---|---|
| edgeR, DESeq2 | Do individual transcripts increase/decrease in expression? Do genes change in total abundance? | TSENAT targets isoform-usage complexity rather than total gene abundance. The entropy functional is invariant to multiplicative changes in total abundance, although estimation precision and regularization can depend on sequencing depth and transcript abundance |
| DEXSeq, DRIMSeq | Which transcripts shift their proportions within genes, independent of abundance changes? | TSENAT detects whether the isoform landscape consolidates or fragments |
| IsoformSwitchAnalyzeR | Which individual isoforms switch; what are the functional consequences? | TSENAT measures overall isoform diversity and diversity shifts rather than cataloging individual transcript switches or predicting functional consequences; complements switch identification with diversity patterns |
| SplicingFactory | What is the overall isoform diversity? | TSENAT extends with scale-dependent diversity (q-spectrum) vs fixed measures |
| Kallisto, Salmon | How many reads per transcript? | TSENAT uses their quantification as input; adds diversity analysis layer |
Native Salmon Integration
TSENAT is specifically engineered to work seamlessly with Salmon quantification output. Rather than requiring manual parsing or format conversion, TSENAT automatically discovers transcript-level quantification files across your Salmon output directory and integrates them directly into the analysis pipeline. This tight integration means you can move from Salmon quantification to entropy analysis without intermediate data manipulation—the raw quant.sf files are all you need. TSENAT discovers these files automatically, validates their compatibility with your experimental design, and handles length-correction and normalization as part of the diversity computation workflow.
To get started with Salmon-quantified data:
suppressMessages(library(TSENAT))

# Prepare configuration FIRST
config <- TSENAT_config(
  q = seq(0, 2, by = 0.1),
  condition_col = "condition",
  sample_col = "sample",
  subject_col = "paired_samples"
)

# Build analysis directly from Salmon output directory
analysis <- build_analysis(
  salmon_dir = "path/to/salmon_output",  # Auto-discovers all quant.sf files
  tx2gene = "path/to/annotation.gff3.gz",  # Transcript-to-gene mapping
  metadata = metadata_df,  # Sample metadata (see structure below)
  config = config
)

# Run analysis pipeline
analysis <- TSENAT(analysis)
Salmon Directory Structure
Your Salmon output must be organized with one folder per sample, each containing a quant.sf file with transcript-level quantification. Sample folder names must exactly match the row names in your metadata file (case-sensitive) to ensure correct sample attribution.
TSENAT expects Salmon output organized with one subdirectory per sample:
salmon_output/
├── sample_1/
│   └── quant.sf
├── sample_2/
│   └── quant.sf
├── sample_3/
│   └── quant.sf
└── sample_4/
    └── quant.sf
Metadata File Structure
Expected TSV file format:
sample      condition    paired_samples
sample_1    normal            A
sample_2    normal            B
sample_3    tumor             A
sample_4    tumor             B
Key requirements:
-
samplecolumn: must match Salmon folder names exactly. -
conditioncolumn: experimental groups. -
paired_samplescolumn: required if using paired designs; identifier for matched samples.
Tests Coverage
Testing is vital in research as it ensures the validity and reliability of results, which is essential for accurately interpreting findings. The report about the current testing coverage can be found here.
License and Attribution
This project is licensed under the GNU General Public License v3.0 (GPL-3). See LICENSE for details.
TSENAT builds upon the SplicingFactory package, extending it with specialized focus on Tsallis entropy analysis.
“If I ever come back from the past, it’s to create a cyclone.”
– Juan José Lozano